If you’re running Facebook Ads campaigns, you know the importance of tracking their performance. With Facebook Ads reporting, you can easily keep track of how your campaigns are doing and make data-driven decisions to optimise them.
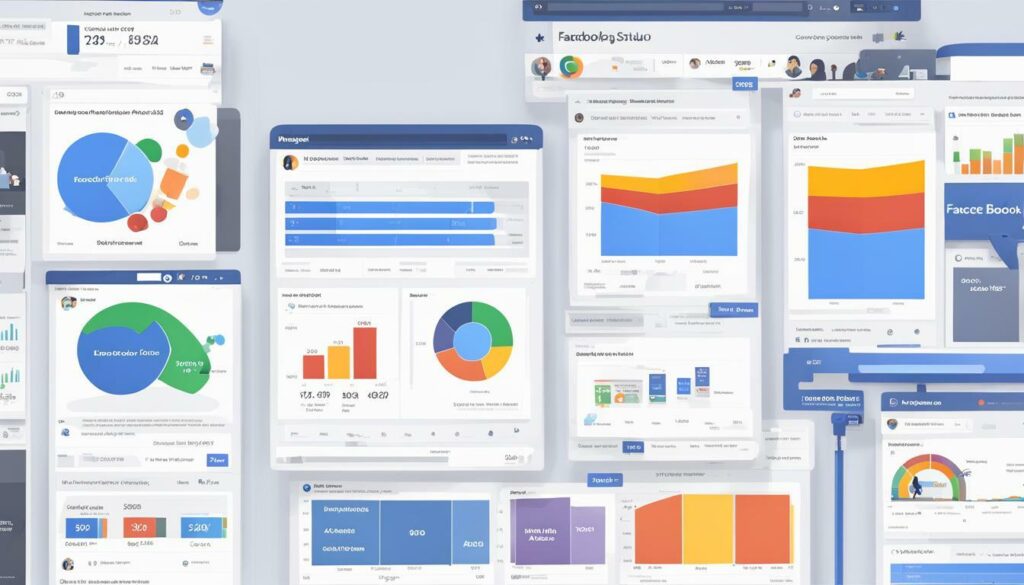
But with the abundance of data available, it can be overwhelming to process and understand. That’s where Google Data Studio comes in. By using this powerful reporting tool, you can create customisable dashboards that display your Facebook Ads performance data in a clear and intuitive way.
In this article, we’ll guide you through everything you need to know about Facebook Ads reporting in Google Data Studio, from understanding the key metrics to tracking and analysing your data. We’ll also provide tips for optimising your campaigns in the UK market and integrating your reporting with other marketing tools.
Key Takeaways:
- Facebook ad reporting is crucial for optimising campaign performance
- Google Data Studio is a valuable tool for visualising and analysing Facebook ad data
- Optimising campaigns for the UK market requires a tailored strategy based on reporting insights
Understanding Facebook Ads Reporting
At its core, Facebook Ads reporting is the process of tracking and analysing the performance of your Facebook advertising campaigns. This data can be invaluable in helping you make informed decisions about how to optimise your campaigns for better results.
There are several types of data available in Facebook Ads reporting, including metrics like impressions, clicks, and conversions. These metrics can provide insight into how your ads are performing and where you may need to make adjustments.
For example, if you notice that your click-through rate is low, you may want to experiment with different ad formats or targeting options to see if you can improve engagement with your audience. Or, if you’re seeing a high bounce rate on your landing pages, you may need to optimise your website to better align with the expectations of your audience.
Ultimately, the goal of Facebook Ads reporting is to help you make data-driven decisions that lead to better campaign performance and ROI.
Benefits of Using Google Data Studio
Google Data Studio offers numerous benefits for Facebook ad reporting. Its customisable dashboards allow us to create visual representations of campaign performance that are tailored to our specific needs. We can also integrate data from other sources, such as Google Analytics, to gain a more comprehensive understanding of our marketing efforts.
Another advantage of Google Data Studio is its ability to track real-time data. We can monitor our campaigns as they happen and make adjustments on the fly, optimising our results in the process.
Furthermore, Google Data Studio is designed to be user-friendly, with drag-and-drop features that make it easy to create reports and dashboards without extensive technical knowledge. This means that we can spend more time analysing our data and less time trying to figure out how to use the platform.
Ultimately, using Google Data Studio for Facebook Ads reporting allows us to gain deeper insights into our campaigns and make data-driven decisions that lead to better results in the UK market.
Setting Up Facebook Ads Reporting in Google Data Studio
Setting up Facebook Ads reporting in Google Data Studio is a quick and easy process that allows you to gain valuable insights into your ad campaigns. Here’s a step-by-step guide on how to get started:
- Connect Facebook Ads to Google Data Studio: To begin, you need to connect your Facebook Ads account to Google Data Studio. This can be done by navigating to the “Data Sources” section in Google Data Studio and selecting “Facebook Ads” as your data source.
- Select your data range: Once you’ve connected your Facebook Ads account, you’ll need to select the date range you want to analyse. This can be done by selecting the “Date Range” option in the top right-hand corner of the screen and selecting your desired range.
- Choose your metrics: Next, you’ll need to choose the metrics you want to track in your Facebook Ads reporting. This can be done by selecting the “Create New Report” option and selecting the metrics you want to analyse.
- Create your report: Once you’ve selected your metrics, you can create your report by selecting the “Create Report” option. This will generate a customisable dashboard that allows you to visualise your campaign performance.
- Customise your dashboard: Finally, you can customise your dashboard to fit your needs by adding filters, charts, and graphs. This allows you to gain a deeper understanding of your campaign performance and make data-driven decisions to optimise your ad campaigns.
By following these simple steps, you can easily set up Facebook Ads reporting in Google Data Studio and gain valuable insights into your campaign performance. With this data, you can make informed decisions to optimise your ad campaigns and drive better results in the UK market.
Key Metrics to Track in Facebook Ads Reporting
When it comes to Facebook Ads reporting, tracking the right metrics is crucial for measuring campaign success and making informed decisions. Here are some of the key metrics that should be monitored regularly:
- Impressions: This measures the number of times your ad was displayed on Facebook.
- Click-Through Rate (CTR): This measures the number of clicks on your ad compared to the number of impressions it received.
- Cost per Click (CPC): This measures the average cost for each click on your ad.
- Conversion Rate: This measures the percentage of clicks on your ad that resulted in a desired action, such as a sale or a sign-up.
- Return on Ad Spend (ROAS): This measures the revenue generated by your ad compared to the cost of running it.
Tracking these metrics in Google Data Studio can help you identify areas for improvement and adjust your campaigns accordingly. For example, if your CTR is low, you may need to revise your ad copy or targeting to make it more relevant to your audience.
In addition to these key metrics, it’s important to consider other factors that may impact your campaign performance, such as time of day, day of the week, and ad placement. By analysing these factors alongside your key metrics, you can gain a more comprehensive understanding of your campaign’s effectiveness.
Analysing Facebook Ads Data in Google Data Studio
Once you have set up your Facebook Ads reporting in Google Data Studio, it’s time to analyse the data to gain insights into your campaign performance.
Google Data Studio offers a range of visualisation options to help you understand your data better. You can create charts and graphs to display different metrics such as impressions, clicks, and conversions. It also allows you to filter your data by different criteria, such as date range or audience demographics.
It’s essential to track your key performance indicators (KPIs) when analysing Facebook Ads data. The KPIs vary depending on your campaign’s goal, but some of the commonly tracked metrics include:
- Impressions – the number of times your ad was shown to a user
- Click-through rates – the percentage of people who clicked on your ad after seeing it
- Cost per click – the average amount you pay for each click on your ad
- Conversion rates – the percentage of people who completed a desired action after clicking on your ad
By regularly monitoring your KPIs, you can identify which parts of your campaign are performing well and which ones need improvement.
Another useful feature of Google Data Studio is that you can share your reports with other team members or stakeholders. This ensures everyone is on the same page, and you can collaborate more effectively to optimise your campaigns.
Overall, analysing Facebook Ads data in Google Data Studio is an essential step in optimising your campaigns to achieve better results. By using the insights gained from your data, you can make informed decisions about how to improve your ad copy, targeting, or budget allocation.
Tips for Optimising Facebook Ads Campaigns in the UK Market
Now that you have set up your Facebook Ads reporting in Google Data Studio and analysed the data, it’s time to use the insights to optimise your campaigns for the UK market. Here are some tips:
- Target the right audience: Use the audience insights gathered from your Facebook Ads reporting to refine your targeting. Experiment with different age ranges, locations, and interests to see which combinations perform best.
- Location-specific messaging: If you are targeting different locations in the UK, tailor your messaging to reflect the local culture and preferences. This can help increase engagement and conversions.
- Test ad creatives: Try out different ad creatives, such as images, videos, and carousel ads, to see which ones resonate best with your target audience. Use the reporting data to assess performance and make adjustments accordingly.
- Optimise landing pages: Ensure that your landing pages are optimised for the UK market. Use language and imagery that resonates with your target audience and make sure the page is easy to navigate and mobile-friendly.
- Time your ads: Experiment with different times of day and days of the week to see when your target audience is most active on Facebook. Use this information to schedule your ads for maximum impact.
- Monitor competition: Keep an eye on your competitors’ Facebook Ads and adjust your strategy accordingly. Use the reporting data to see how your campaigns stack up against theirs and make adjustments where necessary.
By implementing these tips, you can use the insights gathered from your Facebook Ads reporting in Google Data Studio to optimise your campaigns for the UK market and achieve better results.
Integrating Facebook Ads Reporting with Other Marketing Tools
While Facebook Ads reporting in Google Data Studio provides valuable insights into campaign performance, integrating it with other marketing tools can give a more comprehensive understanding of how your ads fit into the overall marketing strategy. By connecting Facebook Ads reporting with tools such as Google Analytics and CRM systems, you can gain insights into the customer journey from initial ad engagement to conversion.
Integrating Facebook Ads reporting with other marketing tools can also help you measure the impact of your campaigns on other channels. For example, if you notice a spike in website traffic from an ad campaign, you can use Google Analytics to see if that traffic is converting into sales or if it is just driving more traffic to the site.
Furthermore, integrating Facebook Ads reporting with marketing tools can help streamline marketing efforts by allowing you to analyse performance data across multiple platforms and channels in one place. This can save time and increase efficiency, allowing you to focus on making data-driven decisions to optimise campaigns and drive better results.
In conclusion, integrating Facebook Ads reporting with other marketing tools is essential for gaining a comprehensive understanding of campaign performance and its impact on overall marketing efforts. By combining the data from various sources, marketers can make informed decisions to optimise campaigns and drive better results.
Conclusion
Overall, Facebook Ads reporting in Google Data Studio is a powerful tool for optimising campaigns in the UK market. By understanding the types of data available and utilising the benefits of Google Data Studio, marketers can track key metrics and gain valuable insights into campaign performance.
Setting up Facebook Ads reporting in Google Data Studio can seem daunting at first, but our step-by-step guide makes the process easy to follow. Once the reporting is set up, it’s important to track the right metrics, such as impressions, click-through rates, and conversion rates, to gain a comprehensive understanding of campaign performance.
With the ability to analyse Facebook Ads data in Google Data Studio, marketers can create visualisations that help them identify trends, spot opportunities for improvement, and make data-driven decisions. By using the insights gained from Facebook Ads reporting, marketers can optimise their campaigns specifically for the UK market.
Integrating Facebook Ads reporting with other marketing tools, such as Google Analytics or CRM systems, can provide a more comprehensive view of campaign performance. This can help marketers better understand the impact of Facebook Ads on their overall marketing strategy and make informed decisions to improve ROI.
In conclusion, utilising Facebook Ads reporting in Google Data Studio is a crucial step for any marketer looking to optimise their campaigns in the UK market. By tracking key metrics, analysing data, and integrating reporting with other marketing tools, marketers can gain a competitive edge and achieve greater success with their advertising efforts.
FAQ
Q: How does Facebook Ads reporting in Google Data Studio help optimise campaigns in the UK market?
A: Facebook Ads reporting in Google Data Studio provides valuable insights into campaign performance, allowing businesses to track key metrics and make data-driven decisions to optimise their ads for the UK market.
Q: What types of data can be accessed through Facebook Ads reporting?
A: Facebook Ads reporting provides access to a wide range of data, including impressions, clicks, click-through rates, conversions, and cost-per-action, among others.
Q: How can Google Data Studio benefit Facebook Ads reporting?
A: Google Data Studio offers customisable dashboards and visualisations, allowing users to create interactive reports that highlight the most important metrics and trends from their Facebook Ads campaigns.
Q: How do I set up Facebook Ads reporting in Google Data Studio?
A: To set up Facebook Ads reporting in Google Data Studio, you need to connect the two platforms through the Facebook Ads connector, select the desired data sources, and configure the data fields and metrics to be displayed in your reports.
Q: What are some key metrics to track in Facebook Ads reporting?
A: Key metrics to track in Facebook Ads reporting include impressions, click-through rates, cost-per-click, conversion rates, and return on ad spend, among others.
Q: How can I analyse Facebook Ads data in Google Data Studio?
A: In Google Data Studio, you can analyse Facebook Ads data by creating charts, graphs, and tables to visualise performance trends and identify areas for optimisation.
Q: What are some tips for optimising Facebook ad campaigns in the UK market?
A: To optimise Facebook Ads campaigns in the UK market, it is important to analyse the reporting data, target the right audience segments, localise ad content, and continuously test and refine your campaigns based on the insights gained.
Q: Why is it important to integrate Facebook Ad reporting with other marketing tools?
A: Integrating Facebook Ads reporting with other marketing tools, such as Google Analytics or CRM systems, provides a holistic view of campaign performance and enables businesses to better understand the impact of their ads on overall marketing efforts.
Q: What is the importance of utilising Facebook Ads reporting in Google Data Studio for optimising campaigns in the UK market?
A: Utilising Facebook Ads reporting in Google Data Studio allows businesses to gain valuable insights into their campaign performance, make informed decisions based on data, and optimise their ads to reach and engage their target audience in the UK market more effectively.


